by Alvin Spence, Centro Incorporated, USA
The effects of various processing conditions are investigated to demonstrate how this method can provide a more precise means by which to control the process. Advancements in this area will provide the molder with a higher quality product, as the cure of the molded part is critical in governing the end product’s mechanical properties.
Traditional Process Control Indicators
 For polyethylene (PE) materials, molders have historically relied on basic tests and indicators to gauge the quality of the molded part[1]. These indicators have typically been one of the following:
- Low temperature impact strength
- Bubble content in the wall cross section
- Internal surface appearance/color/odor
- External surface appearance
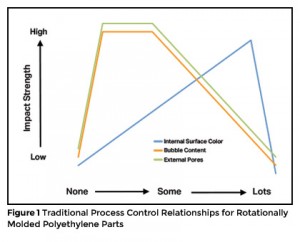
While other mechanical tests do exist, low temperature dart impact is by far the most widely used and least expensive test to perform. A correctly processed part will typically yield ductile impact behavior (or acceptable impact strength without failing) depending on the material type, density and melt index. Bubble content is also a common process control indicator, and can greatly influence the mechanical strength of the molded material. High bubble content across the wall thickness of the parts suggests low cure, while little or no bubble content suggests high cure. However, the propensity of bubbles in any material is influenced by other factors such as the material’s melt index and molecular structure[2]. Very high melt flow materials (typically 6 g/10min or greater) will allow bubbles to dissolve relatively quickly, making it more difficult to know if the material is cured properly or over cured. For the most commonly used melt index materials (typically 2 – 6 g/10min) molders like to see some bubbles in the wall of the cross section to know that over cure has not taken place. For natural parts and most colors, the inner surface of the part can provide more process control information. A lumpy or rough surface texture suggests low cure (or a poor quality grind), while a discoloration suggests over cure due to oxidation. When this takes place, the inner surface of the part will exhibit a burnt odor. The external surface of the part may experience poor fill or surface porosity, which could be an indicator of low cure. This could also be due to incorrect resin selection, poor quality grind, or excessive moisture content. The relationships between these traditional process control indicators are summarized in Figure 1.
While in their own way the process control indicators outlined can provide an effective means to gauge the quality of the molded part, they all have the shortcoming of being post-molded control methods.
Current Scientific Process Control Indicators
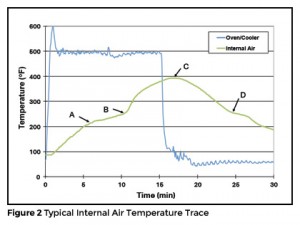 In the early 1990’s it was discovered that monitoring the internal air temperature of the mold during processing provided a more scientifically precise way to determine the amount of cure experienced by the part during the molding cycle[3]. The first commercial system that was capable of doing this was called the “Rotolog”. It consisted of an insulated electronic system, (used to take temperature measurements) and a radio frequency transmitter. The Rotolog mounts to the arm of the machine and travels with the mold through the oven and cooling chambers, taking temperature measurements (via thermocouples) from inside the mold, transmitting them in real time to a receiver, linked to a PC. Since then, other commercial units such as K-PaqTM, TempLogger, DATAPAC and slip-rings (K-KONTROL) have all been successfully used to gather this data. A typical output for the mold’s internal air temperature can be seen in Figure 2.
From the trace, the following critical points have been identified:
- Point A – The beginning of the phase change from solid to liquid, as fine plastic particles begin to melt and adhere to the wall of the mold.
- Point B – All of the plastic particles have melted and the polymer is now a high viscosity liquid.
- Point C – The mold’s peak internal air temperature (PIAT) experienced during the cycle.
- Point D – Phase change from liquid back to solid, as the plastic solidifies.
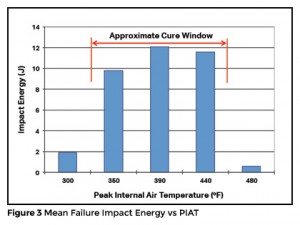 When considering process control, typically point “C” on the internal air temperature trace has the greatest importance, as this point reflects the highest temperature experienced by the internal surface of the part. In general, the peak internal air temperature (PIAT) has often been directly correlated to the amount of “cure” experienced by the part[4 & 5]. This claim has been substantiated by impact testing parts that have been molded to a range of peak internal air temperatures – see Figure 3. Typically, an optimum range of cure or “cure window” can be identified for each material with upper and lower cure boundary limits. Knowing what the cure window is for a particular resin, allows the molder some flexibility to adjust the cycle when the need arises, knowing that a good part will still be produced. This is particularly critical when running multiple molds on one arm that may have slight variations in wall thickness, polymer being used or mold size configuration.
In recent years, infrared thermometry (IRT) has been successfully used as a method to provide process control for rotational molding[6]. This system gathers real-time temperature measurements from the external surface of the molds rotating inside the oven and cooling chambers. This data can then be used to control the indexing of the arms to and from the oven and cooler, as well as controlling some of the cooling process parameters. One of the benefits of the IRT system is that it provides a repeatable process when cycle parameters have been established. However, IRT is not capable of providing temperature measurements from inside the mold, which are critical in knowing the thermal cycle experienced by the polymer.
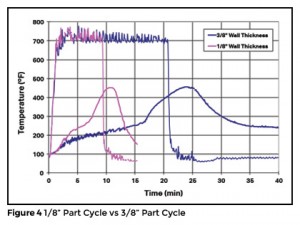 Generally speaking, internal air temperature measurement provides the molder with critical information by which the molding cycle can be controlled. However, the PIAT control parameter has some limitations when considering products made from the same PE material, but molded to different wall thicknesses. For example, would a 1/8” thick part require the same PIAT as a 3/8” part to yield acceptable cure? The answer is probably not, as the 3/8” walled part remains in its molten state for approximately 3 times longer than the 1/8” walled part – see Figure 4. For the thinner walled part to achieve good mechanical properties (i.e. good cure), the material needs a sufficient amount of time to allow bubbles to diffuse from the melt. Bubble removal is a time-temperature relationship. Therefore, the same result can be achieved if the polymer goes to a higher temperature for a shorter period of time or a lower temperature for a longer period of time. For the thicker walled part, the risk of oxidation is much greater due to the extended cycle time. Therefore, it is probably better to process the thicker walled part to a lower PIAT, provided there is enough time available to allow sufficient bubble diffusion to take place to yield acceptable mechanical properties. So, is there a more accurate way to control the process?
 The Future for Process Control?
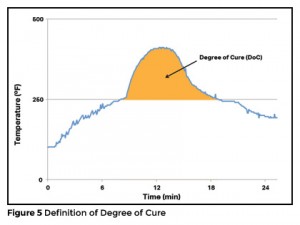
The future of process control could be to utilize some of the methods previously mentioned, but analyze the data they provide in a different way. This process control concept uses the area under the internal air temperature curve, above the melting temperature of the plastic (250°F for polyethylene), as a process control indicator. Figure 5 defines the area under the curve, referred to as the “degree of cure” (DoC), with units of degree-minutes. It is suggested that this measurement provides a more accurate means to gauge cure than any of the previous methods mentioned, as it can compensate for variations in molding cycle conditions. This method takes into account the time-temperature aspect of processing, potentially a more accurate process control parameter.
The Influence of the Heating Cycle on the DoC
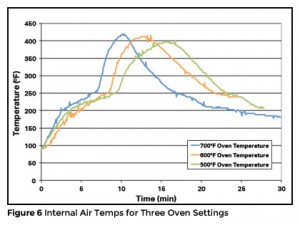 Changes to the oven cycle demonstrate the benefits of measuring DoC. For example, Figure 6 illustrates internal air temperature measurements of the same part molded at three different oven temperatures, using a cast aluminum mold. For these parts, the peak internal air temperature was approximately 420°F for the 700°F oven, 410°F for the 600°F oven and 400°F for the 500°F oven setting. The DoC measurements for these moldings can be seen in Table 1.
From Table 1, the Degree of Cure measurement would suggest that the part molded in a 700°F oven experienced a much lower level of cure than the other two parts, as the material remained in its liquid state for a much shorter period of time.
Correlating DoC to Properties and Appearance
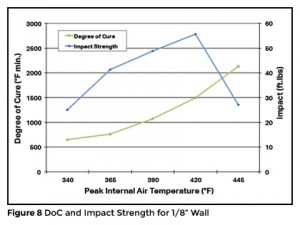
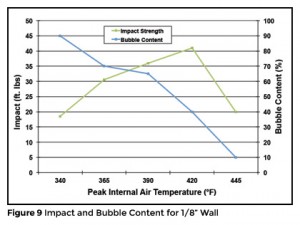
A series of molding trials carried out at Queen’s University Belfast[7] confirmed the relationship between DoC, bubble content and impact properties. During these trials a 3.4 g/10min melt index material was molded with a range of peak internal air temperatures and the ARM impact resistance was measured for each molding. Samples were also cross sectioned and the presence of bubbles was estimated as a percentage of the overall wall thickness. Figures 7, 8 & 9 illustrate DoC, bubble content and impact strength, plotted against PIAT, for a 1/8” wall thickness part.
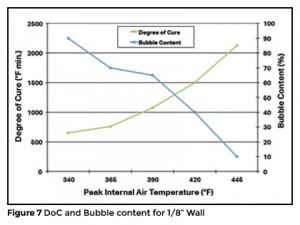 The results illustrated in Figure 7 indicate that the correlation is similar to what we would expect when using PIAT as a process control indicator, in that a higher degree of cure results in more bubbles being removed from the wall of the part. Similarly, Figures 8 & 9 show as the cure level increases, and the bubbles decrease, the impact strength rises until it reaches a point where the inner wall of the part has oxidized, resulting in brittle failure at a PIAT of 445°F. The data suggests for this particular material, molded with a 1/8” wall thickness, that the maximum allowable DoC lies somewhere between the last two data points on the DoC curve (i.e. between 1,500 and 2,127°F. min).
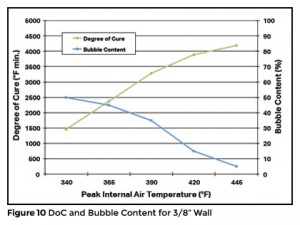
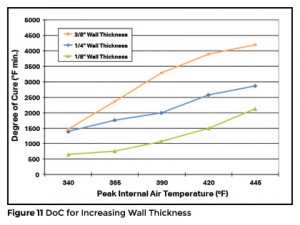
These experiments were repeated with thicker walled parts (see Figure 10) and found that similar relationships existed. However, the degree of cure value increased for different wall thickness of parts (see Figure 11), therefore making it difficult to have a generic DoC number when trying to use this method as a process control indicator for parts of increasing wall thickness.
While DoC appears to have great potential as a process control tool, more work is needed to prove out the ideas presented in this article with a broad range of materials, process conditions and wall thicknesses.
Conclusions
From this work, the following conclusions are suggested:
- Monitoring the peak internal air temperature during the rotational molding cycle can provide a reasonably accurate means by which to judge the cure of the part – provided there are no significant changes in the processing parameters.
- Monitoring the Degree of Cure has the potential to provide a higher level process control. This technique has been shown to correlate to traditional methods to gauge cure, such as bubble content in the wall of the part and impact strength.
- The DoC value will increase with increasing part wall thickness. While this is not necessarily a limitation, it needs to be taken into consideration when identifying the DoC cure range.
References
- Andrzejewski, S. Simple Rules to Follow for Obtaining the Proper Cure for Rotomolded Polyethylene Parts, Rotation, Vol. VI, Issue 3, 1997.
- Spence, AG. Analysis of Bubble Formation and Removal in Rotationally Moulded Products, Queen’s University Belfast, Ph.D. Thesis, May 1994.
- Crawford, RJ and Nugent, PJ. A New Process Control System for Rotational Moulding, Plastics, Rubber and Composites Processing and Applications, Vol. 17, Issue 1, 1992.
- Spence, AG and Crawford, RJ. The Effect of Processing Variables on the Formation and Removal of Bubbles in Rotationally Molded Products, Polymer Engineering and Science, Vol. 36 Issue 7, 1996.
- Crawford, RJ and Nugent, PJ. Impact Strength of Rotationally Moulded Polyethylene Articles, Plastics Rubber and Composites Processing and Applications, Vol. 17, Issue 1, 1992.
- Nugent, PJ, Little, E and Peev, G. The Use of Non-Contact Temperature Sensing in Extending Process Control for Rotational Molding, Society of Plastics Engineers ANTEC 1997.
- Treacy, R. US Rotational Moulding Material Property Differences, MSc. Thesis, Queen’s University Belfast, September 1998.
from an article at RotoWorld®
https://rotoworldmag.com/rotational-molding-process-control-past-present-future/
No comments:
Post a Comment